Specifying the path model and examining data
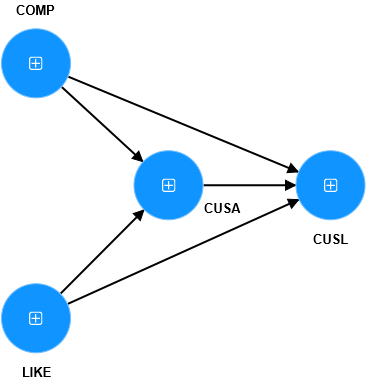
The most effective way to learn how to use a statistical method is to apply it to a set of data. Throughout this book, we use a single example that enables you to do that. We start the example with a simple model, and in Chapter 5, we expand that same model to a much broader, more complex model. For our initial model, we hypothesize a path model to estimate the relationships between corporate reputation, customer satisfaction, and customer loyalty.
The example will provide insights on:
(1) how to develop the structural model representing the underlying concepts/theory,
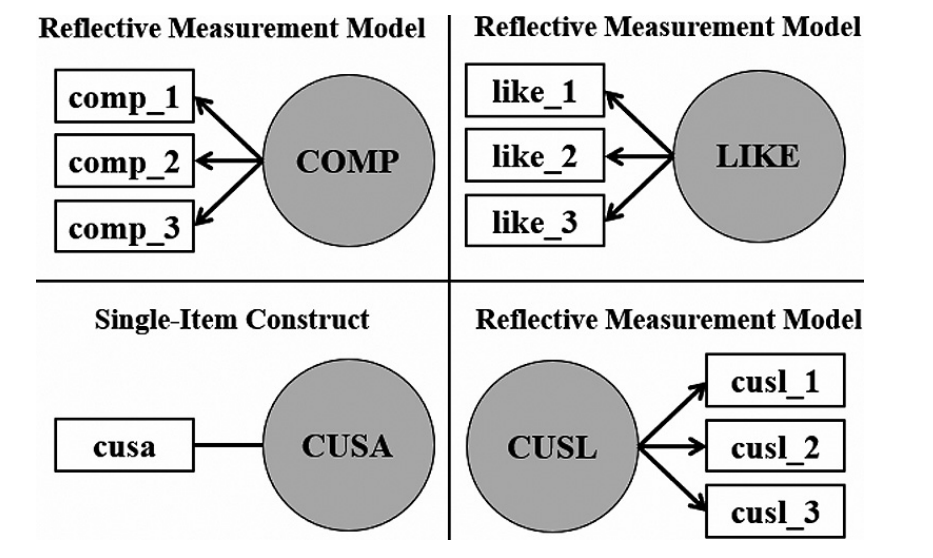
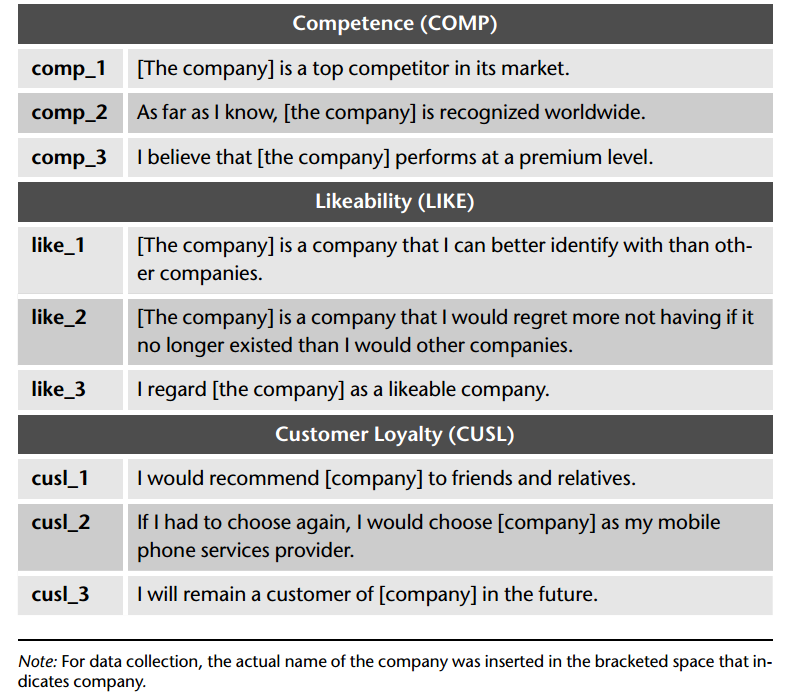
(2) the setup of measurement models for the latent variables,
(3) the structure of the empirical data used.
Then, our focus shifts to setting up the SmartPLS 4 software (Ringle, Wende, & Becker, 2022) for PLS-SEM.
Welcome to our guide on creating your first regression model using SmartPLS! In this tutorial, we will guide you through the following steps:
- Selecting a SmartPLS workspace folder
- Creating a new project and importing a dataset
Throughout the tutorial, we will be using SmartPLS to perform a regression analysis and visualize the results. Make sure you have downloaded and installed the software before beginning. Let's get started!
Selecting a SmartPLS workspace folder
When you open SmartPLS for the first time, you will be prompted to Select a Workspace folder. This folder serves as the default location for storing all of your SmartPLS projects.


Nhận xét